In brief
- Observations are from October 12; NASA published the comparison on October 23.
- Similar maps do not guarantee identical local effects.
Two dates worth keeping separate
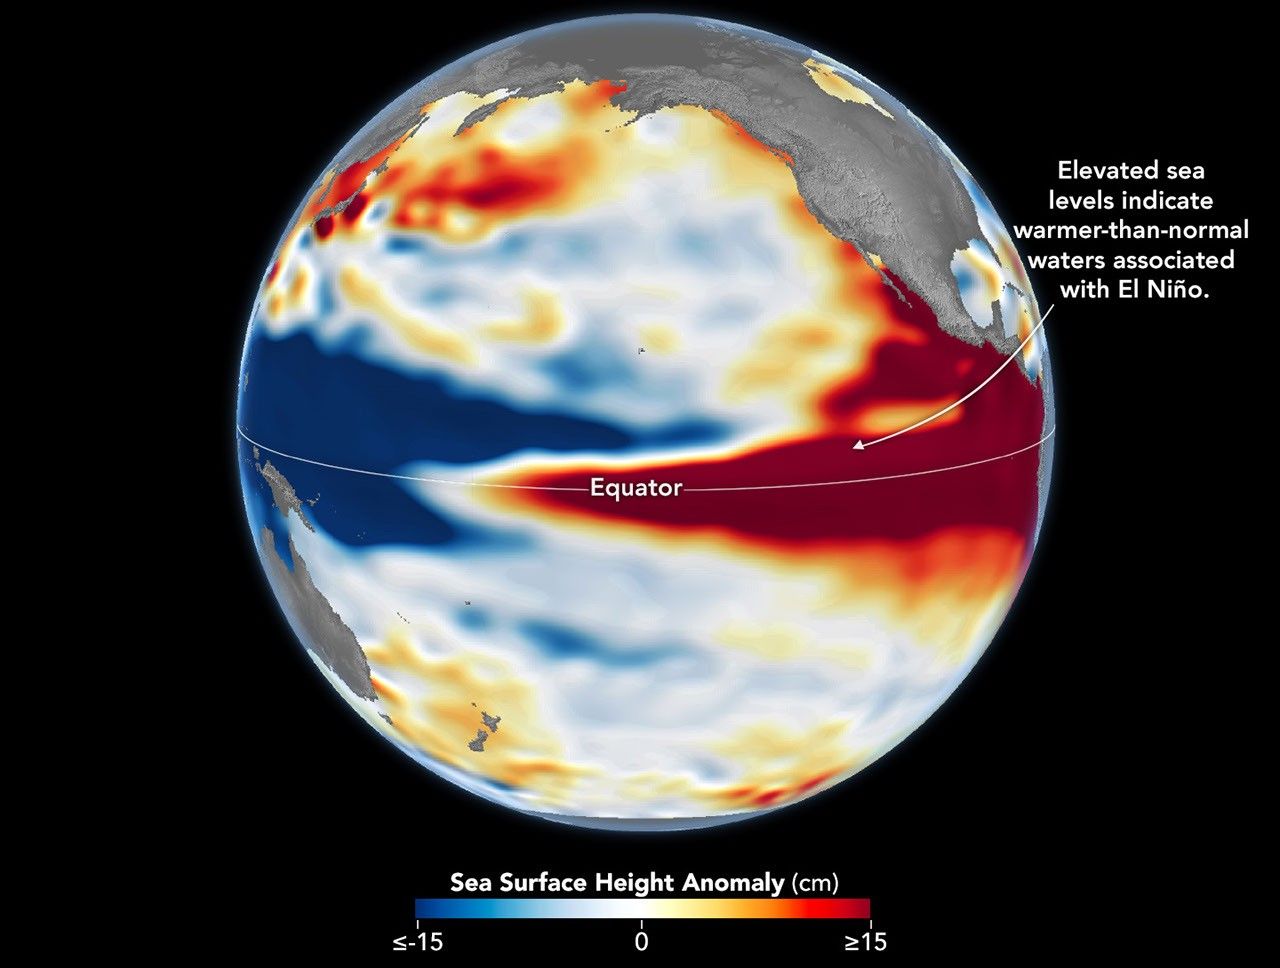
On October 23, NASA Earth Observatory published a comparison of the 2026 El Niño with earlier events. The current map uses observations from October 12: the publication date is not the measurement date.
The comparison shows above-normal sea levels across the central and eastern equatorial Pacific, with a pattern resembling 1997. The agency draws on 35 years of satellite measurements to put the situation in context.
Water height tells a story too
Water expands as it warms. Measuring the height of the ocean surface helps track where that heat builds up and moves. The map’s colors represent departures from usual levels; they are neither a photograph of red water nor a flood map.
Scientists removed seasonal signals and long-term trends to highlight changes associated with El Niño and other short-term natural phenomena. That processing matters when comparing images from different years.
A global signal does not settle local weather
NASA cautions that every event has its own character and that the atmosphere adds uncertainty. Resembling 1997 does not guarantee the same effects. The comparison cannot tell us how much rain a particular Mexican neighborhood will receive this winter.
To read an image like this clearly, first check what the scale measures, when the observations were made and which area it covers. This simple habit helps avoid turning an ocean observation into a prediction the source never made.
Sources and context
Sources used for this article. Follow the links to read the original material.
See the linked sources for more information. Corrections and contact →